How can you determine the success of your social media marketing campaigns? Are you getting a positive return on investments for your social media efforts?
To ensure that you aren’t wasting time and resources on a social media content plan that isn’t working, you need to keep track of key social media KPIs (Key Performance Indicators). These indicators go beyond vanity metrics such as follower count, likes, or fans. You need to track the key metrics that help you reach your business goals. These goals can be anything from increasing traffic to your website, generating more leads, increasing brand exposure, etc.
In this article, the social media KPIs you should be tracking in 2023 would be divided into three main categories:
- Reach
- Engagement
- Conversions
#1 Social Media KPI: Reach
Reach is the total number of people that see your social media posts. You can look at reach as the total number of unique individuals that come across your social media content.
Defining your reach on social media can be difficult since most social media analytics would show you the potential number of people that would see your post. You cannot accurately determine your social media reach just by the amount of followers or fans you have.
Having 500 followers does not mean that 500 of them would see your post. Some might not be online when you make a post. How can you accurately measure your reach?
Post reach
Post reach is defined as the total number of people that have seen your post since it went live. Factors such as timing significantly determine your post reach. Uploading content when your followers are most active online would significantly increase your post reach.
Post Reach Percentage = Post Views / Total followers × 100
So, to calculate your post reach, divide the number of post views by the number of followers you have. So if you have 100 followers and post views is 20, your post reach percentage is (20/100) × 100 = 20% post reach.
Impressions
Impression is the number of times your post shows up on an individual’s feed or timeline. It doesn’t matter if the post was clicked or not. As long a user scrolls through your post on their feed, an impression is counted.
Your number of impressions is usually higher than the number of followers you have. This is because one person can have multiple impressions for a single piece of content. If your followers share your post to their timeline and their followers see it, your impression level increases.
That is why you notice on Twitter that your Twitter impressions are much larger than your number of followers.
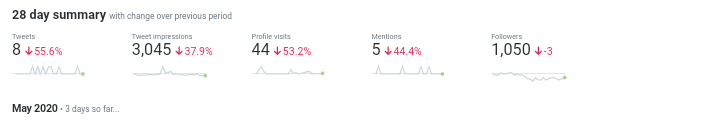
To track whether your impression is improving, compare it with previous days to see the trend. The higher the number of impressions, the better.
Audience growth rate
It is important to track the rate of growth of your audience on social media. You should identify the number of new followers or fans you get at the end of every month. A huge number of new followers would signify that people love your content. If your followers are decreasing, you should go back and evaluate your overall social media strategy.
To get your growth rate percentage, divide the number of new followers by total followers, and multiply the result by 100.
Growth rate percentage = New followers / Total followers × 100
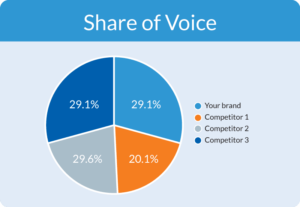
Social share of voice (SSoV)
Social share of voice measures brand exposure based on social media conversation. It is a measure of your brand’s visibility when compared with your competition. The more your social share of voice, the greater your popularity among your audience and potential customers.
The social share of voice helps you define your position in your industry. With SSoV, you can determine how many times your brand is mentioned on social media when compared with your competitors.
To calculate your social share of voice,
- Measure any mention of your brand (for example, directly; @HopperHQ or indirectly; HopperHQ) for a particular period.
- Measure your competitions mentions also
- Add your mentions and that of your competition to get the total mentions
So the formula to track the SSoV Percentage:
SSoV Percentage = Your Mentions / Total Mentions × 100
#2 Social Media KPI: Engagement
A basic definition of social media engagement would be the measurement of metrics such as likes, comments, and shares. While it is important to keep track of vanity metrics like this, they won’t give a good insight into the engagement level on your posts. There are other ways to determine if people are interacting with your content.
Average engagement rate
Instead of just calculating the number of shares, comments, and likes that your posts generate, you can measure them in relation to your number of followers.
Average Engagement Rate Percentage = Likes + Comments + Shares / Followers × 100
So if you had 170 likes + 400 comments + 250 shares on a post and have 5000 followers, your average engagement rate percentage would be – (170 + 400 + 250) / 5000 × 100 = 16.4%
Amplification rate
The best thing about social media is that you can reach people that are not following you with your content.
Your amplification rate would tell you the number of your followers that are sharing your content. Depending on the platform, this can be a retweet (Twitter), shares (Facebook), or repins (Pinterest). A high amplification rate shows that your followers enjoy your content so much that they feel that others should see it.
Amplification Rate Percentage = Shares / Followers × 100
Virality rate
Virality rate is the measure of the number of people that shared your post relative to the number of people that saw it (i.e number of impressions) for a particular reporting period.
Virality Rate Percentage = Shares / Impressions × 100
A post can be shared a lot of times but have a low virality rate.
If your post was shared 5,000 times and you have 100,000 followers, the virality rate would be 0.5%. Compare that to another post that was shared 3,000 times with 10,000 followers. The virality rate would be 30%.
#3 Social Media KPI: Conversions
To find out how effective your social media is in helping you reach your business goals, these are the social media KPIs you should track.
Conversion rate
How many clicks does it take before visitors take a desired action?
When visitors click on the call to action buttons on your social media posts and are directed to your landing page, do they take a specific action? Like subscribing to your newsletter or downloading your software demo.
A high conversion rate would mean that people are not just clicking on your offers but are also taking the desired action the page was created for. The more relevant your value proposition, the higher your conversion rate.
Conversion Rate Percentage = Conversions / Clicks × 100
Click-through rate (CTR)
For this KPI, you would track the rate of people that are clicking on your call-to-action buttons.
How do you calculate the number of people that click on your website/landing page links and additional content?
CTR Percentage = CTA Clicks on a post / Impressions × 100
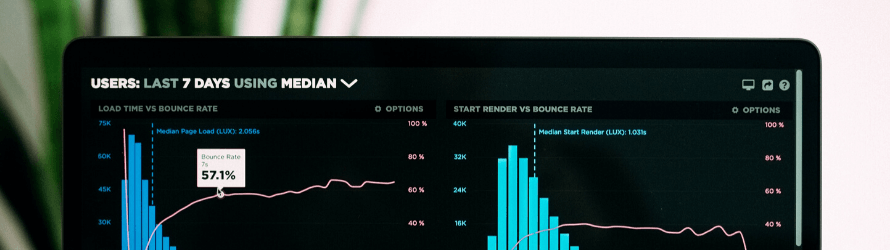
Bounce rate
Bounces occur when people click on your CTA button and leave the page without taking any action. This could happen when visitors cannot relate to your value proposition or the copy on your landing page is poor and unconvincing.
Bounce rate is an important social media KPI. You would use it to determine how your social media traffic compares to other forms of traffic like search engines.
To calculate your bounce rate, you would have to set up Google Analytics. Then,
- Go to the ‘Acquisition’ tab
- Look under ‘All Traffic’
- Click ‘Channels’
- Click on the Bounce Rate button
- Look at the bounce rate for each channel
Cost-per-click (CPC)
When you are running ad campaigns on social media, it is important that you calculate your ROI. How much are you paying for each click and are you getting a positive return on investment for money spent?
It is important that you track your total spend on a set of ads, the number of clicks on that ad, and the cost-per-click.
Cost-Per-Click = Total Ad Spend / Total Measured Clicks
You can check out our article on how to create successful social media ads.
Social media conversion rate
This is the total number of conversions that you get from social media expressed as a percentage. This KPI allows you to measure the effectiveness of your social media campaign. With this metric, you can determine if your audience liked your offer or not.
For example, If your goal for a social media campaign is to increase the number of new subscribers to your newsletter, this is the formula you would use.
Social Media Conversion Rate = Social Post Visitors / New Subscribers × 100
Conclusion
No matter the marketing channel you are using, performing in-depth analytics helps you measure the effectiveness of your campaign. Regarding social media, you need to constantly track these social media KPIs listed above to ensure that you are meeting your business goals.
Which of these social media KPIs have you been tracking in the past, and are there any key metrics you think should be added to the list? Leave your thoughts in the comment section.
Follow the Digital marketing Experts to learn more.
 Marvellous Aham-adi is a freelance writer and Head of Content at TheZeroed. Where he writes on actionable marketing tips you can use in growing a brand. He has been featured in top blogs like Social Media Examiner, GetResponse, Mention, and Wordstream. Connect with him on LinkedIn.