We use cookies to analyse traffic and improve your experience. Accept all to help us make Hopper HQ better, or reject non-essential cookies. See our Privacy Policy.
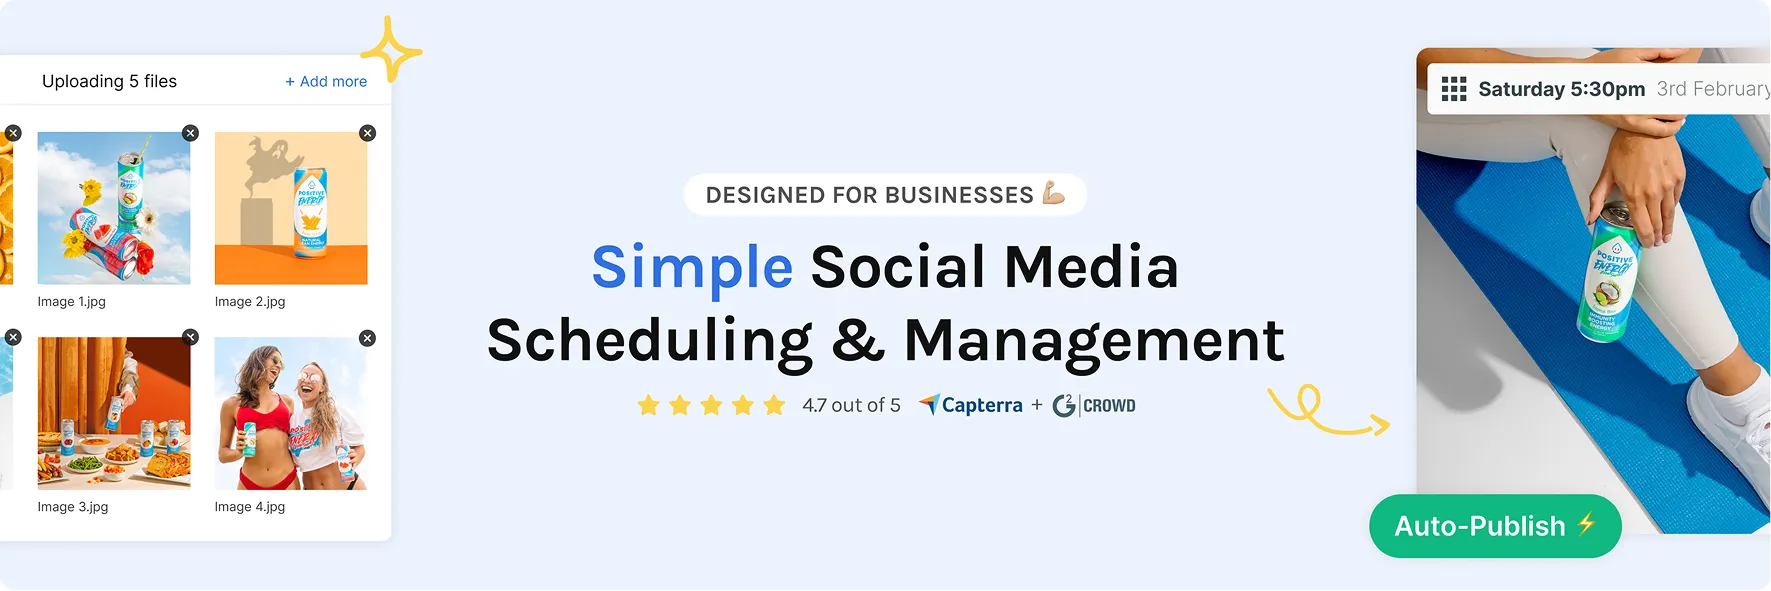
Track what’s working. Fix what’s not. Grow with confidence. Hopper HQ’s social media analytics software gives you the insights you need.

Clarity leads to confidence. We’ll help you find both.
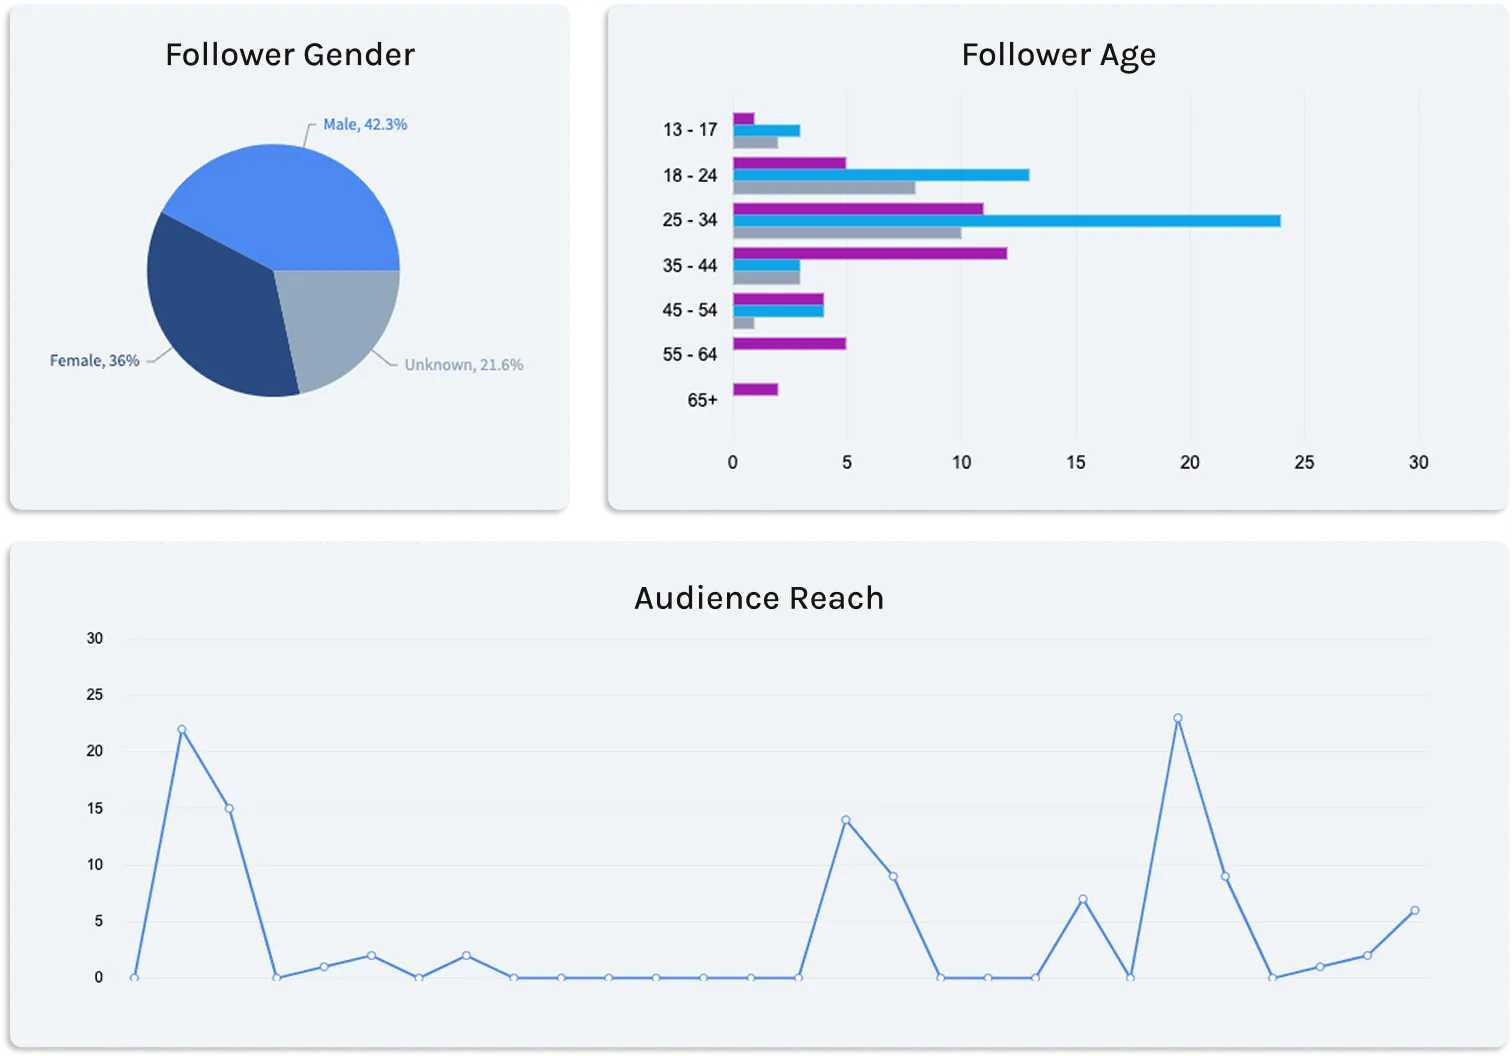
Stop guessing and start connecting. Understand who’s following you, when they’re most active, and what they actually engage with.
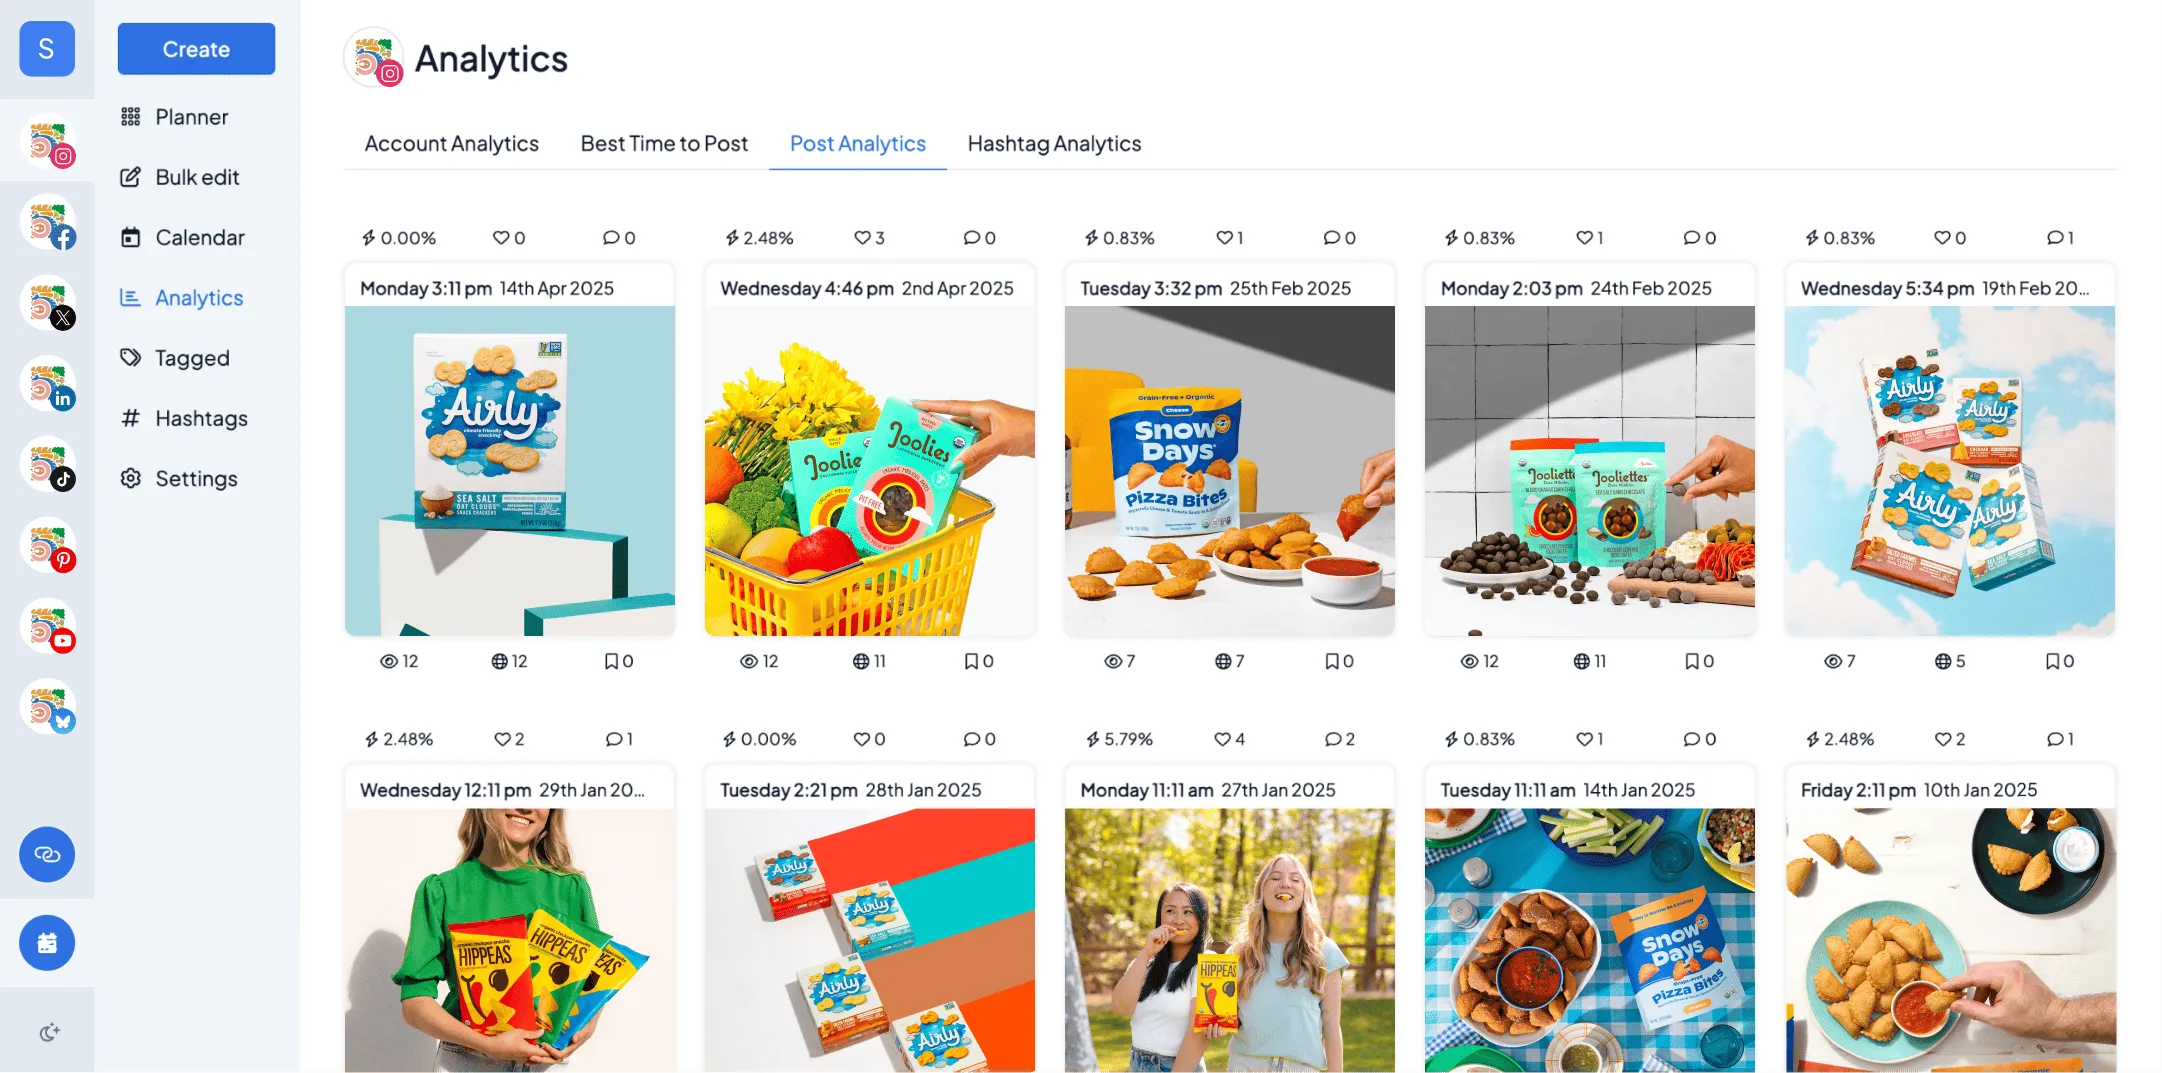
Quickly see which posts are getting results and build on what’s already working.
From follower count to website clicks, keep an eye on what’s really moving the needle. All in one clean dashboard.
Powerful enough to guide your strategy. Simple enough to understand at a glance.
See the numbers that matter - engagement, reach, follower trends - with zero fluff.
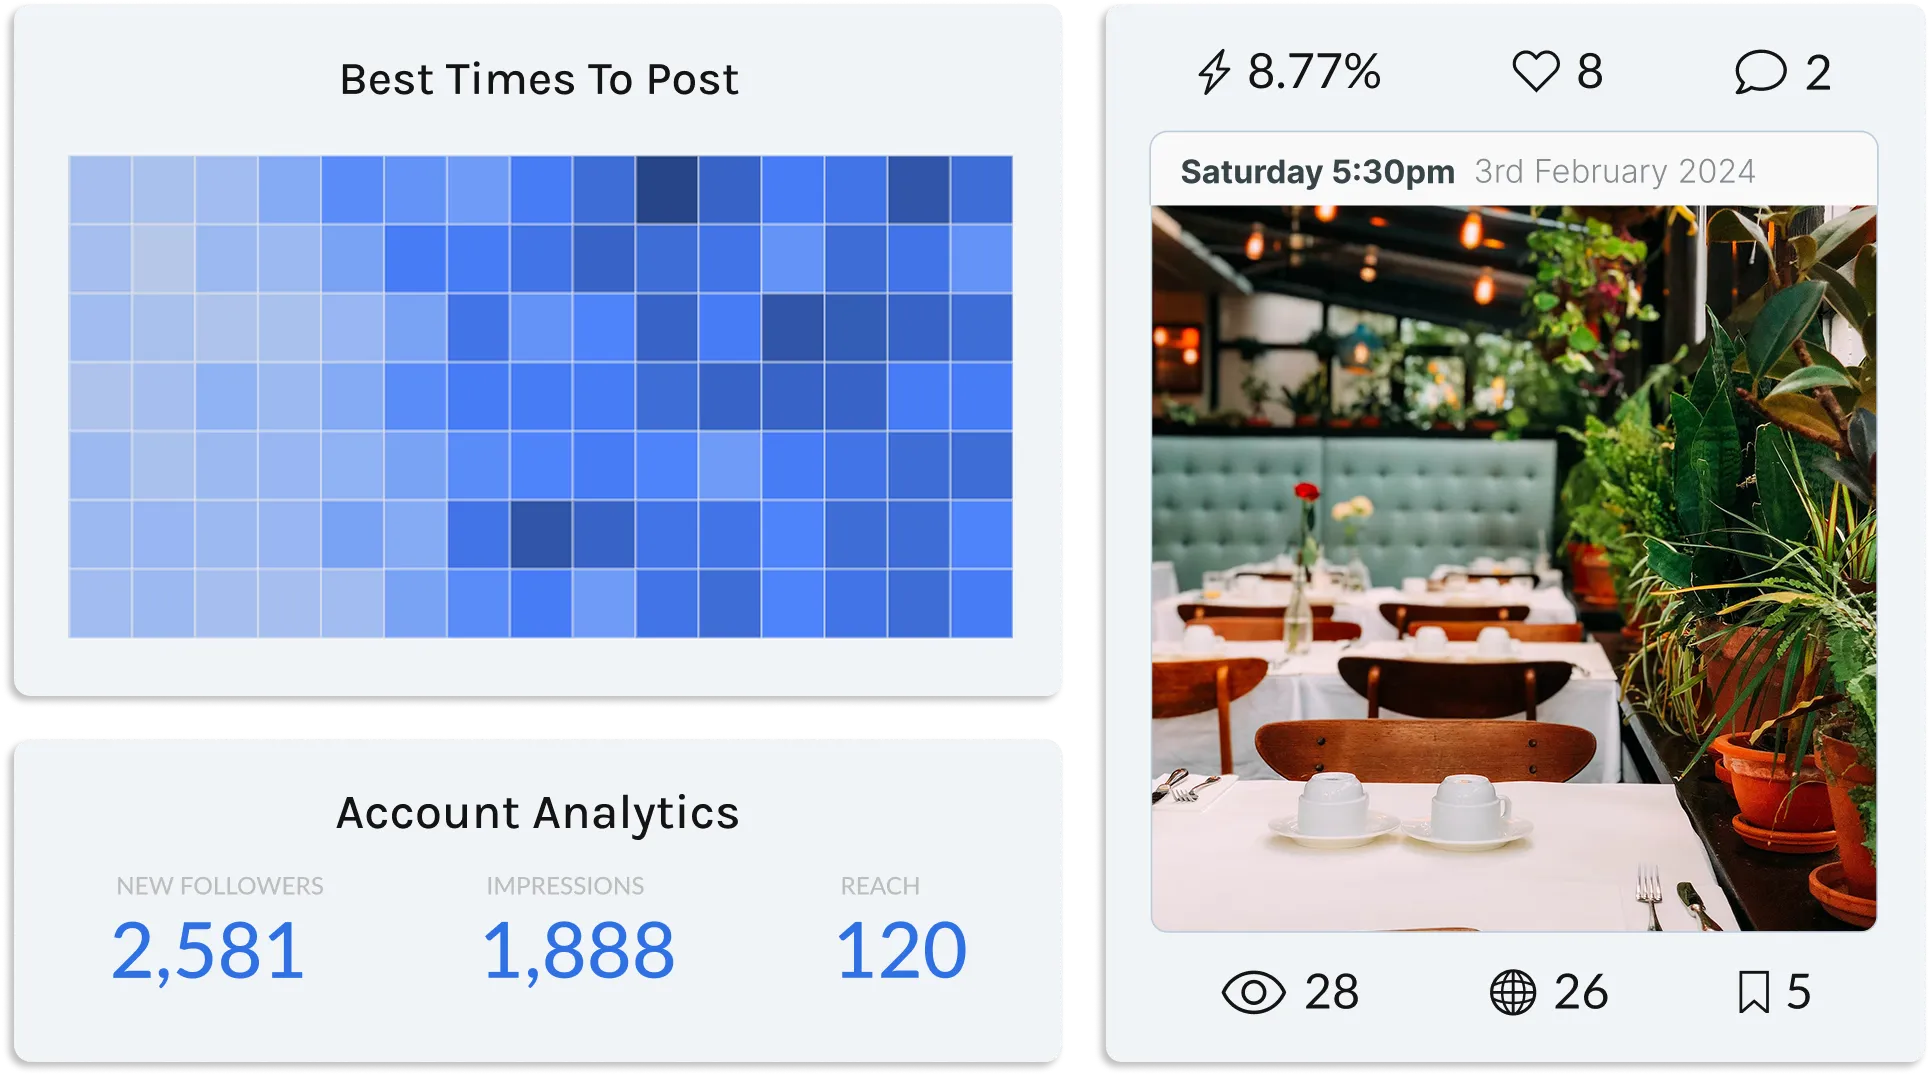
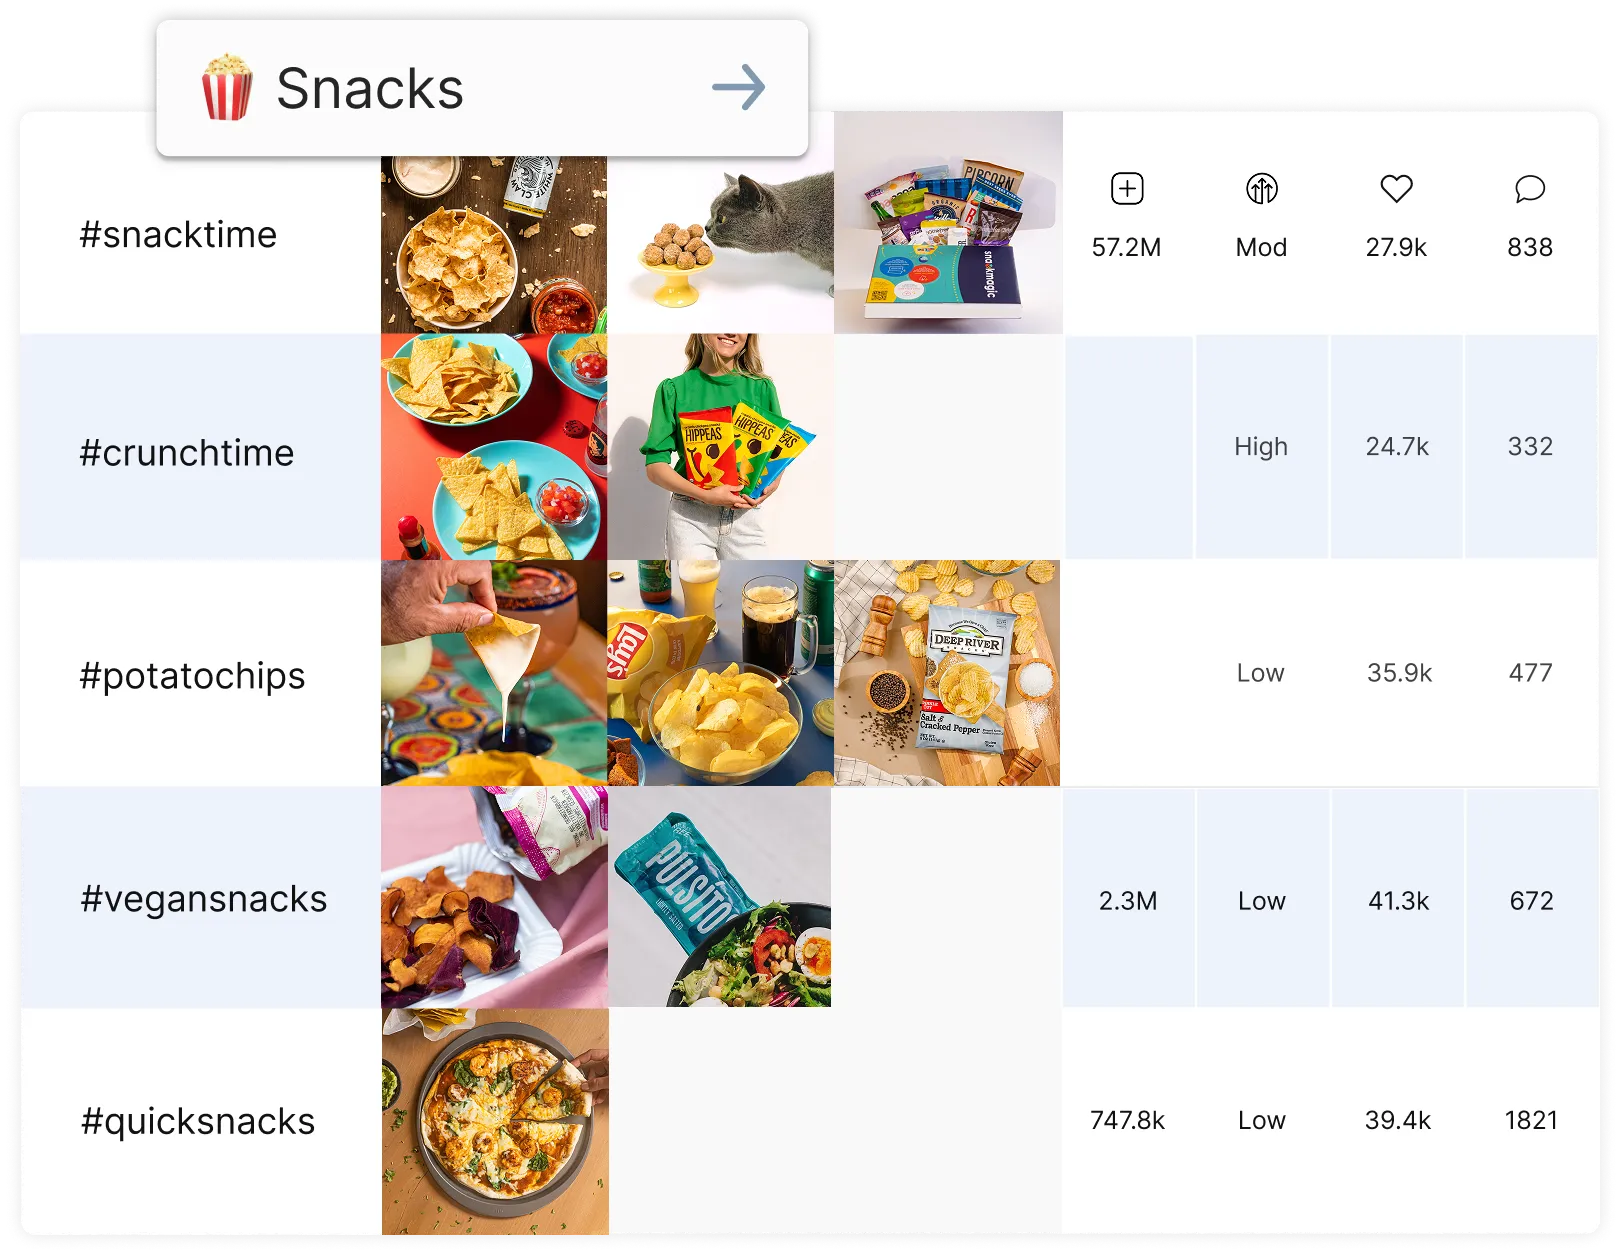
Learn the best times to post, what content resonates, and how often to show up.
Export in a click.
This is how social media analytics should feel.
You don’t have time to overthink. Let Hopper HQ highlight what’s working, so you can act on it right away.
Instead of reinventing the wheel, lean into what’s already resonating.
No complicated dashboards. No confusing charts. Just actionable information, in plain English.

Hopper HQ tracks engagement, reach, follower growth, website clicks, impressions, and more. All your key numbers are in one clean dashboard, so you can see what's working at a glance.
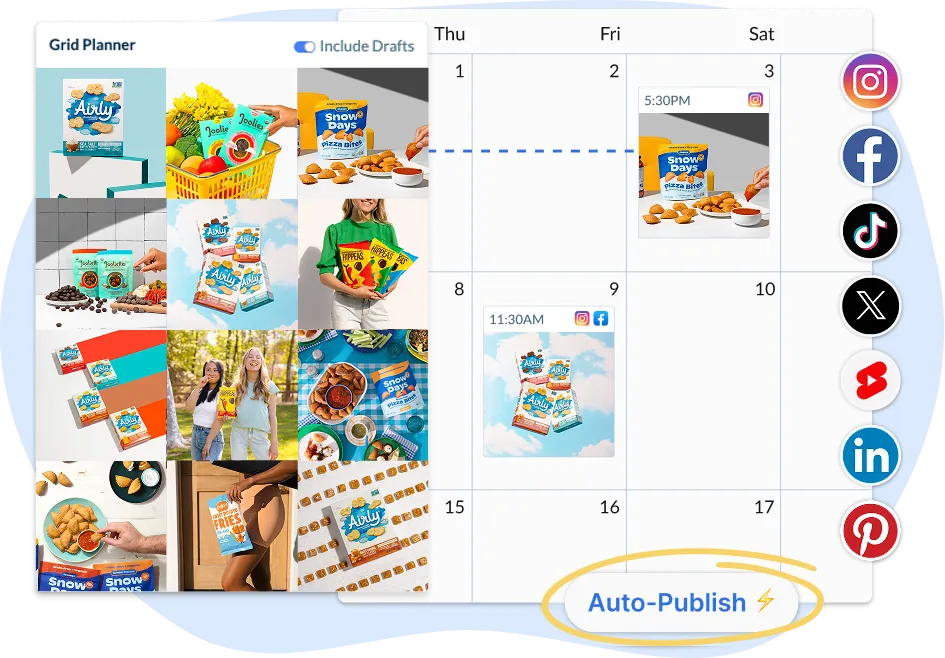
Hopper HQ analytics covers Instagram, Facebook, Threads, LinkedIn, TikTok, Pinterest, X (Twitter), and YouTube Shorts. You get a unified view of your performance across every channel you post on.
Yes. Hopper HQ shows your top-performing posts by engagement, reach, and clicks. It's straightforward to spot patterns and build on content that's already connecting with your audience.
Yes. Hopper HQ analyzes your audience's activity and highlights when your followers are most active. Post when they're online and get more out of every piece of content you share.
Yes. Download your reports with one click and share them with clients or your team in seconds. No extra steps, no formatting headaches.
Yes. Hopper HQ shows your follower trends over time so you can see whether your strategy is building an audience. You'll know exactly when growth picks up or slows down.